/ Infrastructure
Infrastructure monitoring should start before an outage
Answer ops questions with monitoring, combine infrastructure metrics with app signals, and build alerts your team acts on. Turn every outage into a lesson.
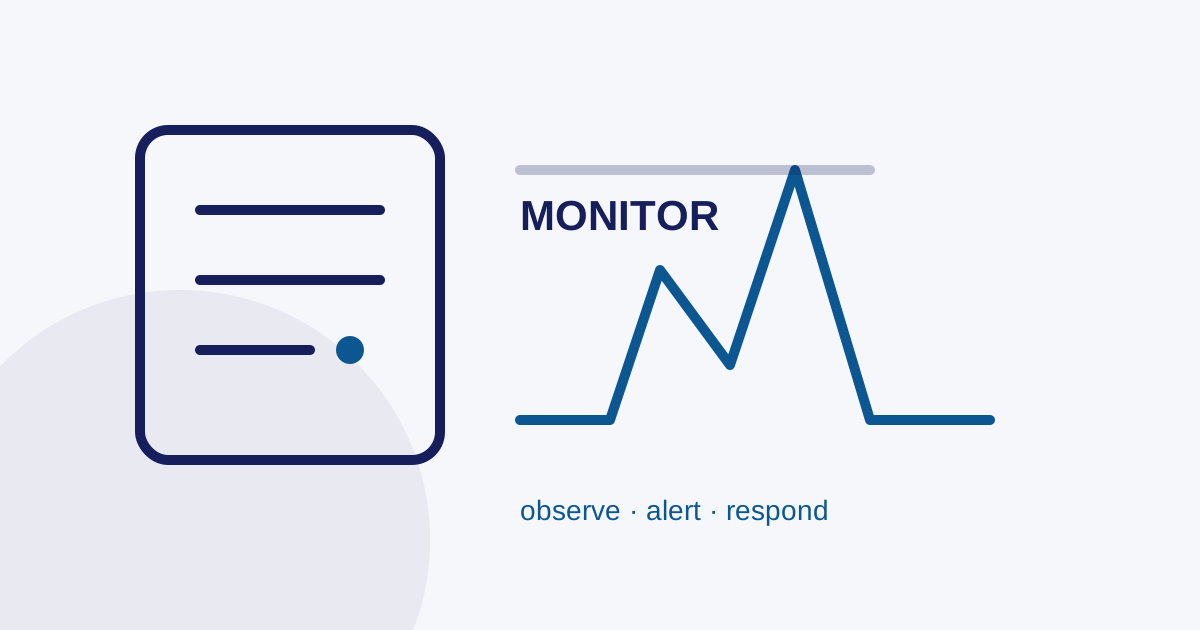
Monitoring should answer operational questions
Start with questions, not dashboards
Monitoring is not just a dashboard opened after a server fails. Its purpose is to provide context before a decision is needed: is capacity shrinking, is latency rising, is an error coming from the application or a dependency, and did the last backup complete? Without context, teams react to guesses and lose time during incidents.
Map every question to a signal and an owner
Start with questions such as: can users log in, does checkout complete, is the API responding, is disk capacity sufficient for growth, and are scheduled jobs running? Each question needs an observable signal and an owner who knows the first response. The guide to backup and recovery covers the last question in more detail.
Combine technical and application metrics
Correlate infrastructure and application data
CPU, memory, disk, network, and uptime remain important, but they do not always explain business impact. Combine them with request errors, latency on important endpoints, job queues, webhook failures, or stuck transactions. Correlation helps separate symptoms from root causes and makes prioritization easier.
Design dashboards for two modes
A dashboard should support normal operations and incidents. During normal operations, show capacity trends and changes that need planning. During an incident, show service status, recent changes, dependencies, and links to recovery procedures. Record deploys, firewall changes, credential rotation, and database migrations so timing can be compared quickly. For a deeper look at how Google runs production systems, see the Site Reliability Engineering book.
Make alerts actionable
A useful alert has a trigger, severity, recipient, and first action. An 80 percent disk warning may create a planning ticket, while an unavailable payment service may require immediate escalation. Avoid overly sensitive thresholds because alert fatigue makes important notifications easier to ignore.
Set a baseline before changing thresholds. A new system may have expected spikes during a batch, while the same spike during transaction hours may indicate a problem. The baseline should account for busy periods, scheduled deploys, backups, and seasonal patterns.
Treat monitoring as an operating habit
Once alerts are active, review them regularly. Which alerts produced action, which were irrelevant, and which incidents went undetected? Improve runbooks from real experience. Also monitor backup status, the age of the latest copy, storage capacity, and restore-test results.
Managed monitoring can help when an internal team lacks the time or coverage to watch infrastructure consistently. Still, escalation boundaries must be written down: who receives alerts, support hours, required access, and available reports. Clear boundaries matter more than a promise that every problem will disappear.
Close incidents with learning
Close every incident with a short review. Record the timeline, first detection, changes, successful actions, and confusing points. Focus on improving the system rather than finding someone to blame. The result may be a new threshold, runbook, permission boundary, or architectural change.
Start with a few core services and schedule maintenance for dashboards, obsolete alerts, and owners. Systems change: endpoints appear, providers change, and traffic patterns grow. Monitoring understood by the whole team is more effective than a broad system nobody reviews.
Frequently asked
Questions teams ask before implementation
- What should you monitor first?
- Start with operational questions: can users log in, does checkout complete, is the API responding, and did the last backup finish? Each question needs an observable signal and an owner who knows the first response action.
- How do you avoid alert fatigue?
- Give every alert a trigger, severity, recipient, and first action. Avoid overly sensitive thresholds. Review alerts regularly — remove those that never produce action, and add new ones for incidents that went undetected. Set baselines before tuning thresholds.
- What is the difference between monitoring and observability?
- Monitoring tells you when something is wrong. Observability helps you ask why it happened by combining infrastructure metrics with application signals, request traces, and change logs. Correlation separates symptoms from root causes and makes prioritization easier.
This article is part of Satu Pintu Digital's field notes. The next article covers a related topic.
Keep reading